primeimages
“I’m not telling you it’s going to be easy – I’m telling you it’s going to be worth it.” – Art Williams
To My Partners and Friends:
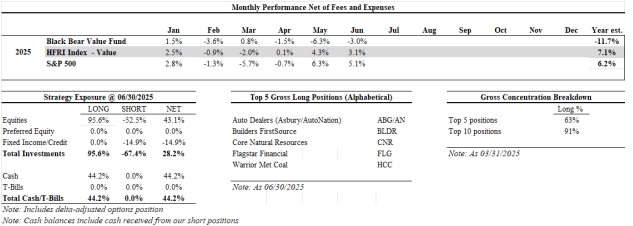
Black Bear Value Fund, LP (the “Fund”) returned -3.0% in June, -10.5% in the quarter and -11.7% year-to-date. The S&P 500 returned +5.1% in June, +10.9% in the quarter and +6.2% year-to-date. The HFRI Index returned +3.1% in June, +7.7% in the quarter and +7.1% year-to-date. We do not seek to mimic the returns of the S&P 500 and there will be variances in our performance.
Note: Additional historical performance can be found on our tear-sheet.
Although our Partnership has a long-term mindset, I am realistic that short-term underperformance and in particular drawdowns can be a source of consternation. Note that as we sit here in early July the portfolio has partially rebounded as a few of the catalysts described later started to come to fruition. The portfolio is a coiled spring, with lots of bad news/expectations priced into what we own, and good news/magical thinking priced into what we are short. Many of our businesses are experiencing hard catalysts in the coming 6-18 months which will unlock lots of cash and value (more on this below).
I generally reserve a more fulsome portfolio discussion for year-end but feel it’s appropriate to have a more detailed Q2 letter. I would encourage you to read the Company updates, even if they are long held positions, as I discuss the ideas in more detail. I am including the business performance thru the companies’ latest earnings release as well.
A little more than half of our negative mark to market is a result of our short portfolio. In the 2nd quarter, many money-losing companies went up sharply. This is temporary. We’ve been through this before and ultimately the short book has helped us make up ground in dramatic fashion. As a reminder in 2022 when the market was down 18%, we were able to report a +12% year in large part due to our short portfolio. Our short portfolio will help us again even though the temporary mark to market is aggravating.
Several of our companies have hard catalysts in 6-18 months which will produce a large amount of cash flow. Management teams can either buy back stock, pay dividends or utilize in another accretive manner. Many of our companies are already experiencing trough conditions and are priced as if this will continue ad infinitum. Things will improve and along with it sentiment. As painful as mark-to-market losses are, we own Companies that are proactive in buying in cheap stock. When sentiment improves there is less stock available, and prices move up a lot (See BLDR or AN historical performances).
Here is a rough summary of some of our 2025-2026 catalysts:
- Core Natural Resources: One of their larger met coal mines is offline and will return.
- Warrior Met: The Blue Creek development will be completed, and the Company will gush cash
- Flagstar: As the turnaround continues progressing, the Bank will get back to profitability and look better than their competition
- Franklin Street Properties (FSP) – A distressed REIT we own that has several activists involved (one on Board) – is currently working with Bank of America on a strategic review.
- Leon’s Furniture (OTCPK:LEFUF) – Leading Canadian furniture retailer (70% owned by founding family) that is spinning off real estate that’s equal to near the 2/3 of the entire Company market cap.
Top 5 Businesses We Own (Alphabetical)
Auto Dealers: Asbury Group & AutoNation (ABG/AN)
Asbury Group (ABG) and AutoNation (AN) operate auto dealerships across the United States. The strength of the model comes from the back of the house in parts and services where more than 50% of the profits come from. Auto retailers are resilient businesses that generate strong free cash flow even in soft markets. ~90% of auto dealerships are privately owned providing a long-term runway for consolidation and growth. There are scale advantages to being a larger public dealer (access to capital for M&A, ability for strong parts/service business as cars become more complex, lower overhead costs, brand equity). The businesses are priced as if there will be no growth.
In the shorter term, tariffs will increase the cost of an automobile (how much is hard to say), reducing the affordability for both new and used cars (holding all else equal). Some of this will be mitigated by a highly variable component in the wage expense. Some damage may also be mitigated by increased activity in the Parts & Service division. The impact of tariffs could take some time to be felt and its uncertain if there will be tax credits/interest deductibility to lessen the pain on American consumers.
Asbury Automotive Group reported a solid, though slightly softened, financial performance in Q1 2025. Revenue declined ~1% year-over-year, with gross profit decreasing 3%. Parts & service remained a bright spot, delivering a same-store gross profit increase of ~5%, driven by strong customer-pay demand (Parts & Service). Management noted resilience amid tariff uncertainty and weather disruptions and reaffirmed its pending acquisition of Herb Chambers Automotive Group, expected to close by mid-2025.
ABG should be able to earn $20-$30 in free cash flow per share in a “normal” year. Additionally, they now provide warranty and service contracts in-house (TCA). This business is worth ~$30-$40 per share. At a quarter-end price of $239 and accounting for a $35 TCA value, we own ABG at ~10-15% free-cash-flow yield. This compares to the S&P 500 which is ~3-4% free-cash-flow yield.
AutoNation reported strong Q1 2025 results, with revenue climbing approximately 3% year-over-year driven by a 7–10% increase in same-store new vehicle sales. Gross profit increased about 2% including a record $568 million in after-sales profit as margins expanded by roughly 140 basis points. Used-vehicle profitability also surged: gross profit per unit rose about 13% to $1,662, and total used-vehicle profit jumped around 12% The Customer Financial Services arm grew ~5–6%, with improved per-unit returns. Capital deployment totaled ~$370 million, including $225 million in share repurchases (reducing shares by ~3%) and $70 million in two store acquisitions. Management highlighted resilient market dynamics, improved inventory efficiency (days’ supply down ~14%), and continued diversification across revenue streams—reinforcing confidence in AutoNation’s robust, multi-channel automotive retail model.
AN should be able to earn $15-$20 in free cash flow per share in a “normal” year. AN also has a smaller lending business that’s conservatively worth ~$8 a share and an AutoNation USA standalone used-car business which is worth ~$15 per share. At a quarter-end price of $199 and accounting for $23 in value from the lending business and AN USA we own AutoNation at 9-11% FCF yield. This compares to the S&P 500 which is ~3-4% free-cash-flow yield.
Builders FirstSource (BLDR)
There is a structural shortage of housing in the USA. Higher mortgage rates reduce the supply of existing home supply as homeowners are locked into low-rate mortgages. As we have seen in recent history, the overall pie of housing activity may shrink, with new homebuilders capturing an increasing share of home sales. Homebuilders can buy down the mortgage to a lower rate and accept a lower, yet still healthy margin on the home sale.
BLDR is a manufacturer and supplier of building materials with a focus on residential construction. Historically, this business was cyclical with minimal pricing power as the primary products sold were lumber and other non-value-add housing materials. Since the GFC, BLDR has focused on growing their value-add business that is now 40%+ of the topline. The company has modest leverage and has been using their abundant free cash flow to buy over 45% of their stock in the last 33 months.
Builders FirstSource experienced a sharp downturn in revenue, profit, and cash flow in Q1, reflecting broader market softness. However, the company delivered a modest earnings surprise, maintained strong liquidity, and continued to invest in operational efficiencies and shareholder returns, signaling confidence in its long-term strategy despite current headwinds.
Of most importance, Q1 is one of their slowest quarters (winter is slow for homebuilding) and BLDR maintained its 2025 outlook, targeting $16.05–17.05 billion in net sales, gross margins of 29–31%, adjusted EBITDA of $1.7–2.1 billion, and $800–1,200 million in free cash flow (a 6-9% free cash flow year in a trough year is much improved compared to past slowdowns).
The company has sustained higher gross margins as they have gained scale. I estimate normalized free cash flow per share to be $10-$15 per year implying a free-cash-flow yield of 9-13% with no growth priced in. The reality is due to the housing shortage coupled with acquisitions from smaller competitors; there is a long-term tailwind providing growth. Additionally, local governments are beginning to loosen red tape for home construction, which should help.
Core Natural Resources (CNR)
Core is the result of the merger between Consol and Arch Resources. As a combined entity they are one of the leading producers of metallurgical coal (steel) and thermal coal (energy). The Company is heavily dependent on exports so retaliatory tariffs would be damaging. At the same time, there has been a reduction in global capacity so many countries may not have much choice, especially if they need higher quality coal.
Following its January 2025 merger of Arch Resources and Consol Energy, Core Natural Resources reported Q1 2025 revenue slightly outpacing revenue forecasts. The company allocated $106.6 million to investors via buybacks and dividends and bolstered financial flexibility by refinancing its revolving credit facility. Management emphasized early merger synergies, robust free cash flow, and prudent capital deployment through shareholder returns and site-led efficiencies.
Met coal demand is projected to climb for the next 25 years, driven by the economic development and urbanization in India and the rest of Southeast Asia. ~60% of the world’s population lives in Asia, where met coal demand is centered and where local sources are limited. Over the coming years demand will likely outstrip supply, leading to higher prices. There has been a severe lack of investment in met coal due to ESG concerns with investment peaking in 2014.
One of Core’s met coal mines experienced a fire and will re-open later in 2025. Due to this and lower met coal pricing, Core should generate somewhere between $250-$550MM in free-cash-flow in 2025 (with some upside from merger synergies). This equates to ~$5-$10 in free-cash-flow per share in a weaker year vs. a $70 stock price per (a 7-14% unlevered yield). In a more normal year, when pricing gets back to average and production comes back online, CNR should generate $500MM-$1.0BB ($9-$19 in FCF per year or a 13-27% mid-cycle unlevered yield.
As a reminder, this is a Company with a fortress balance sheet and is one of the cheapest producers in the market. While short-term pain hurts all companies, they can be major long-term beneficiaries.
Warrior Met Coal (HCC)
Warrior Met Coal is a leading metallurgical coal producer (coal used to steel production). Currently the bulk of HCC’s FCF is being invested in a capital project that will be concluding this year. Once the business winds down their investment period, they will gush cash.
In Q1 2025, Warrior Met Coal saw revenue down 40% year-over-year due to compressing met coal prices. Despite a 10% production increase and tight cost control, negative free cash flow of $68 million reflects heavy investment in the Blue Creek mine. Liquidity remains robust at $617 million. Management maintained its full-year guidance, emphasizing the strength of contracted sales, cost discipline, and continued advancement of the Blue Creek project amid market headwinds.
HCC’s existing mines should generate $100-$350MM in annual free cash flow (assuming lower for longer met coal prices). Blue Creek development is wrapping up by the beginning of 2026 and at mid-cycle, should generate $100-$500MM in additional free cash flow. The combined assets should generate $200MM-
$850MM in free cashflow with non-heroic pricing and volume assumptions. This equates to ~$4-$16 in annual per share cash generation vs. a price of ~$46 or a 9-35% unlevered annual free-cashflow yield. 2026 should be a sea-change in their free-cash-flow generation.
Flagstar Financial (FLG)
Flagstar Financial is the former New York Community Bank (a mashup of Flagstar Bank, New York Community Bank and assets from Signature Bank). Like our SHORT investments in Silicon Valley Bank and First Republic, FLG had a hole in their balance sheet (from soured multifamily and office real estate vs. long-duration securities). That is where the similarities end.
FLG raised over $1BB in additional capital, led by former Treasury Secretary Steven Mnuchin. They revamped the management team and brought in a superstar CEO in Joseph Otting. They have reviewed nearly all the loans on the books, sold off non-core assets, raising additional capital and are focused on delivering a narrowly-focused, well-capitalized boring regional bank. In this case, boring is good. Importantly, they have taken a conservative view of their loan book and a large credit reserve. This contrasts with several bank/private credit lenders we are short who have taken minimal reserves.
In Q1 2025, Flagstar Financials’ net interest margin stabilized at 1.74%, and expense controls reduced adjusted non-interest costs by over 20% annually. Strong loan growth (commitments up 32%) and ongoing credit improvement signal operational momentum, while the CET1 ratio of 11.9% and disciplined exposure reduction in commercial real estate reinforce financial stability. With a clear plan focused on cost savings and strategic lending, Flagstar is on track to return to profitability by the end of 2025.
At quarter-end, the bank was trading at ~60% of a conservatively marked balance sheet. This is in contrast with similar banks (who are NOT conservatively marked) trading at 140-160% of their tangible book value. FLG should complete working thru the bulk of their issues by the end of 2025 and approach “normal” during 2026. Given the conservative nature of the management team, I wouldn’t be surprised if it happened sooner. At these prices, the downside seems minimal and could see this business up 50-150% over the next 1-3 years as it is more appropriately valued.
Concluding Thoughts
Animal spirits seem to be in vogue again. I understand that it’s unpleasant to experience a mark-to-market loss, but these have historically proven to be temporary. Our returns are lumpy in nature due to our concentration. We will wind up making money on our shorts as the fundamental weakness in these businesses are exposed as tariff impact and a slowing economy become more evident. Our long investments are long-term beneficiaries of weak share prices and can take advantage of buying back stock. We own a group of businesses that have a lot of bad news priced in at enormous discounts to overall elevated market multiples. Time is our friend.
We know what we own and are sober/objective in our reasoning and will stand to do well in the coming years. Please reach out if the Fund is of further interest.
Thank you for your trust and support.
Black Bear Value Partners, LP 786-605-3019/646-821-1854
|
THIS DOCUMENT IS NOT AN OFFER OF, OR THE SOLICITATION OF AN OFFER TO BUY, INTERESTS IN BLACK BEAR VALUE PARTNERS, LP (THE “FUND”). AN OFFERING OF INTERESTS WILL BE MADE ONLY BY MEANS OF THE FUND’S CONFIDENTIAL PRIVATE OFFERING MEMORANDUM (THE “MEMORANDUM”) AND ONLY TO SOPHISTICATED INVESTORS IN JURISDICTIONS WHERE PERMITTED BY LAW. This document is confidential and for sole use of the recipient. It is intended for informational purposes only and should be used only by sophisticated investors who are knowledgeable of the risks involved. No portion of this material may be reproduced, copied, distributed, modified or made available to others without the express written consent of Black Bear Value Partners, LP (“Black Bear”). This material is not meant as a general guide to investing, or as a source of any specific investment recommendation, and makes no implied or express recommendations concerning the matter in which any accounts should or would be handled. The returns listed in this letter reflect the unaudited and estimated returns for the Fund for the periods stated herein and are net of fees and expenses, unless stated otherwise. Black Bear currently pays certain fund expenses, but may, at any time, in its sole discretion, charge such expenses to the Fund. Please note that net returns presented reflect the returns of the Fund assuming an investor “since inception,” with no subsequent capital contributions or withdrawals. You should understand that these returns are not necessarily reflective of your net returns in the Fund, and you should follow-up with Black Bear if you have any questions about the returns presented herein. An investment in the Fund is speculative and involves a high degree of risk. Black Bear is a newly formed entity with limited operating history and employs certain trading techniques, such as short selling and the use of leverage, which may increase the risk of investment loss. As a result, the Fund’s performance may be volatile, and an investor could lose all or a substantial amount of his or her investment. There can be no assurances that the Fund will have a return on invested capital similar to the returns of other accounts managed by Adam Schwartz due to differences in investment policies, economic conditions, regulatory climate, portfolio size, leverage and expenses. Past performance is not a guarantee of, and is not necessarily indicative of, future results. The Fund’s investment program involves substantial risk, including the loss of principal, and no assurance can be given that the Fund’s investment objectives will be achieved. The Fund will also have substantial limitations on investors’ ability to withdraw or transfer their interests therein, and no secondary market for the Fund’s interests exists or is expected to develop. Finally, the Fund’s fees and expenses may offset trading profits. All of these risks, and other important risks, are described in detail in the Fund’s Memorandum. Prospective investors are strongly urged to review the Memorandum carefully and consult with their own financial, legal and tax advisers before investing. The development of an investment strategy, portfolio construction guidelines and risk management techniques for the Fund is an ongoing process. The strategies, techniques and methods described herein will therefore be modified by Black Bear from time to time and over time. Nothing in this presentation shall in any way be deemed to limit the strategies, techniques, methods or processes which Black Bear may adopt for the Fund, the factors that Black Bear may take into account in analyzing investments for the Fund or the securities in which the Fund may invest. Depending on conditions and trends in securities markets and the economy generally, Black Bear may pursue other objectives, or employ other strategies, techniques, methods or processes and/or invest in different types of securities, in each case, that it considers appropriate and in the best interest of the Fund without notice to, or the consent of, investors. Performance returns compared against benchmark indices are provided to allow for certain comparisons of Black Bear’s performance to that of well-known and widely-recognized indices. Such information is included to show the general trend in the markets during the periods indicated and is not intended to imply that the holdings of any of the applicable accounts were similar to an index, either in composition or risk profile. The indices represented herein are the S&P 500 and the HFRI EH: Fundamental Value Index (“HFRI EH FVI”). The S&P 500 is a free-float weighted/capitalization-weighted stock market equity index maintained by S&P Dow Jones Indices, which tracks the performance of 500 large companies listed on U.S. stock exchanges. The HFRI EH FVI reflects fundamental value strategies which employ investment processes designed to identify attractive opportunities in securities of companies which trade a valuation metrics by which the manager determines them to be inexpensive and undervalued when compared with relevant benchmarks. This presentation contains certain forward looking statements. Such statements are subject to a number of assumptions, risks and uncertainties which may cause actual results, performance or achievements to be materially different from future results, performance or achievements expressed or implied by these forward-looking statements and projections. Prospective investors are cautioned not to invest based on these forward-looking statements. Furthermore, many statements in this presentation are the subjective views of Black Bear, and other reasonable persons may have differing views. Unless it is unequivocally a statement of fact, any statement herein (even if not specifically qualified as an opinion (i.e., with language such as “in the opinion of” or “we believe that”)) should nevertheless be understood and interpreted as an opinion with which reasonable persons may disagree, and not as a material statement of fact that can be clearly substantiated. The information in this presentation is current as of the date listed on the cover page and is subject to change or amendment. The delivery of this presentation at any time does not imply that the information contained herein is correct at any time subsequent to such date. Certain information contained herein has been supplied to Black Bear by outside sources. While Black Bear believes such sources are reliable, it cannot guarantee the accuracy or completeness of any such information. This Presentation has not been approved by the U.S. Securities and Exchange Commission (the “SEC”) or any other regulatory authority or securities commission. This Presentation does not constitute an offer of interests in the Fund to investors domiciled or with a registered office in the European Economic Area (“EEA”). None of the Fund, Black Bear or any of their respective affiliates currently intends to engage in any marketing (as defined in the Alternative Investment Fund Managers Directive) in the EEA with respect to interests in the Fund. Receipt of this investor presentation by an EEA investor is solely in response to a request for information about the Fund which was initiated by such investor. Any other receipt of this investor presentation is in error and the recipient thereof shall immediately return to the Fund, or destroy, this investor presentation without any use, dissemination, distribution or copying of the information set forth herein. |
Editor’s Note: The summary bullets for this article were chosen by Seeking Alpha editors.